Our Sponsor

Kenworth Truck Company is an American truck manufacturer. Founded in 1923 as the successor to Gersix Motor Company, Kenworth specializes in production of heavy-duty (Class 8) and medium-duty (Class 5–7) commercial vehicles. Headquartered in the Seattle suburb of Kirkland, Washington, Kenworth has been a wholly owned subsidiary of PACCAR since 1945,operating alongside sister company (and marketplace rival) Peterbilt Motors.
Project Overview
Problem
The US fuel consumption has been on the rise for the recent years and it has resulted in significant CO2 emissions. Moreover, states governments has set requirements for truck manufacturers to maintain a set amount of Zero-Emissions credits each year.
Solution
we developed a ZEV Dashboard and a credit calculator in excel format for Kenworth using Tableau to help aid the decision making process of the Kenworth Project Planning team.
Stakeholders
The Employees on the Kenworth Project Planning team will benefit from this product
Significance
The stakeholders will receive more insights about the conversion to ZEVs. In addition, The credit and deficit calculator will help the team calculate ZEV credits and deficit and set up plans for future sale of ZEVs regarding climate change.
Features
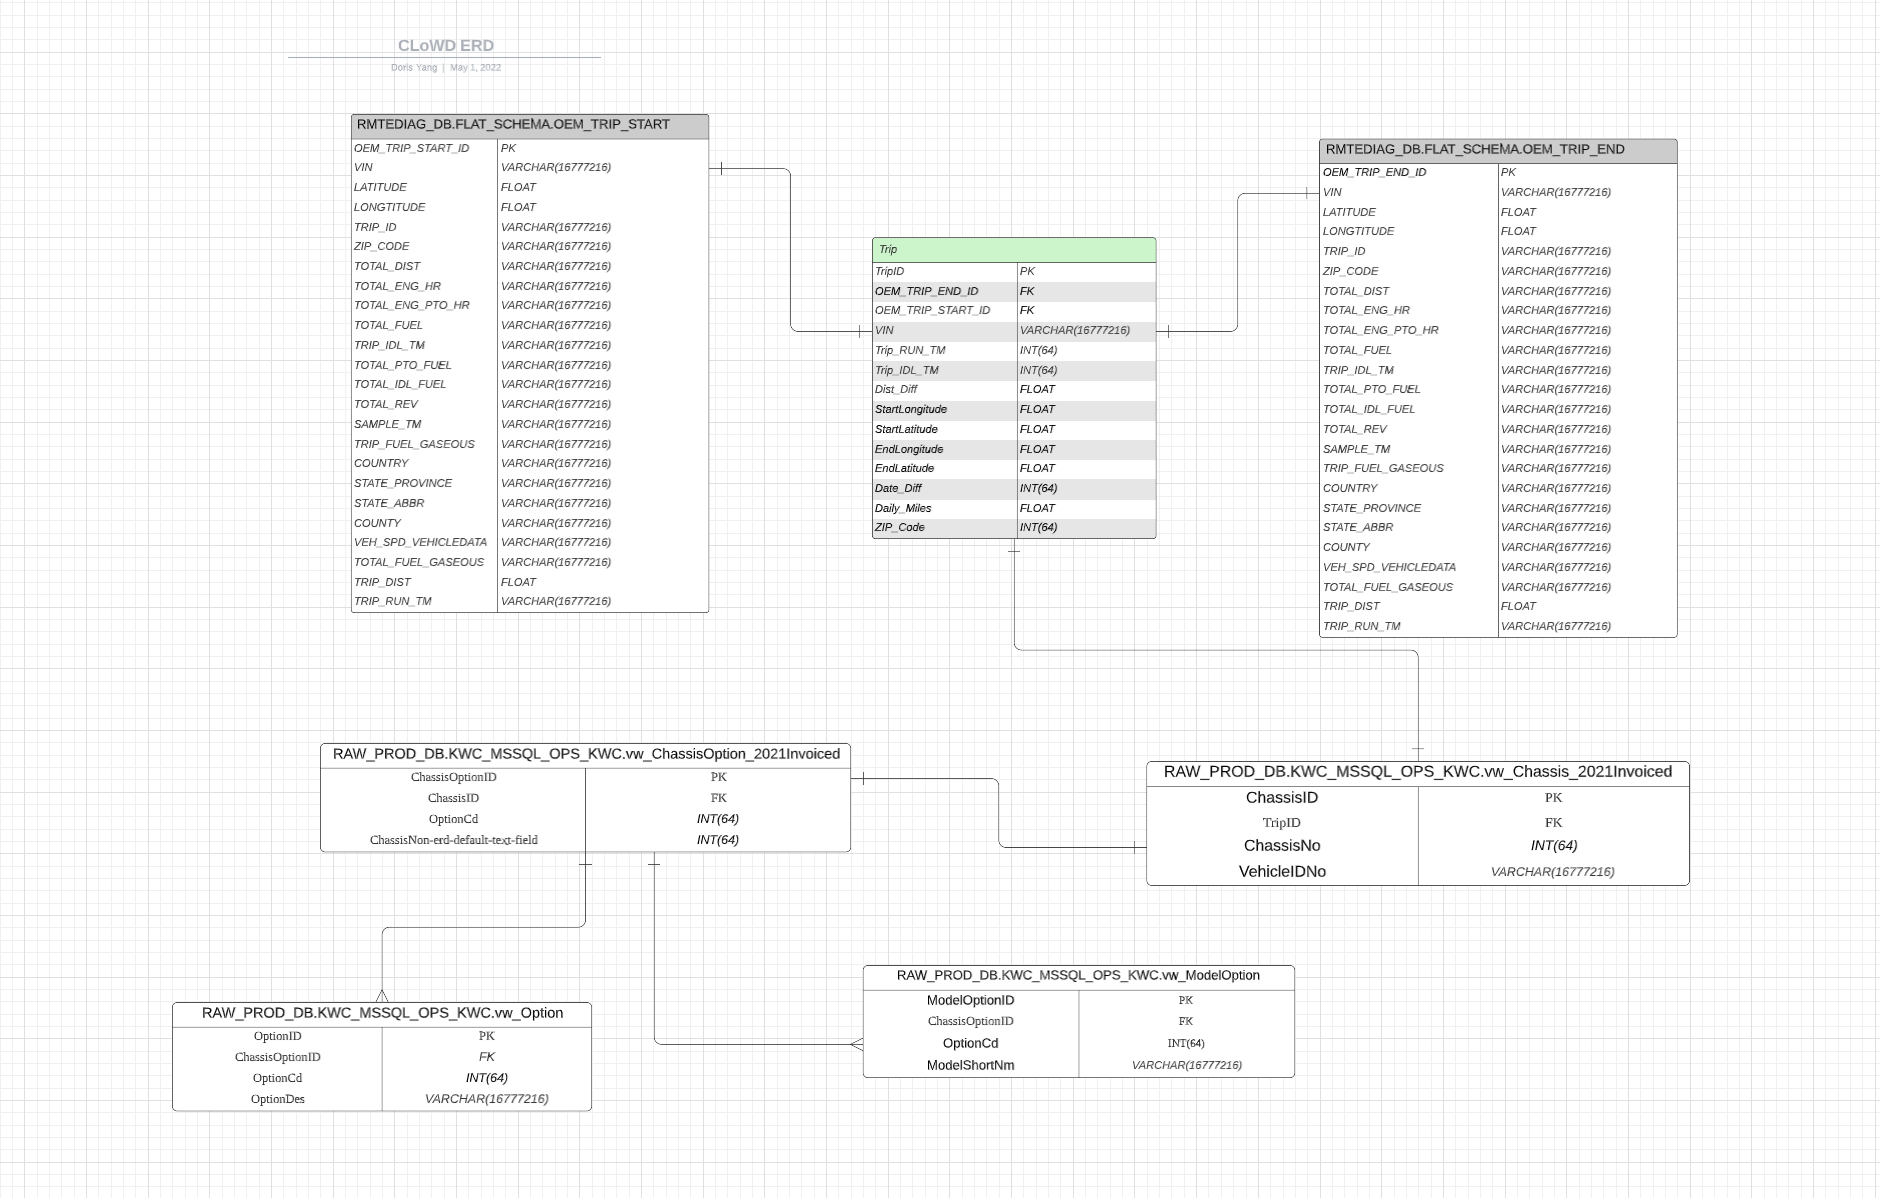
ERD
Kenworth has a massive database, and our task is to organize and gather essential information across many different tables to build our solution. To help Kenworth better visualize and understand the logic of our script on joining and cleaning the data, we created an ERD.
Daily Mileage By Models
To help Kenworth decide on how many more additional batteries will maximize the performance of trucks, this histogram shows the number of trucks that operate over different daily mileage by different models. Users can use the filters next to the graph to focus on a specific truck type. To help highlight the important information, the trucks that run less than 300 mileage, which is powered by 2 batteries, are shown in blue bars and others are shown in grey bars.
Total Market Opportunity By State
Understanding the current market will help Kenworth focus on the target state when transferring to ZEV. To show an overview of the current truck market, this map shows the total market opportunity of Kenworth trucks operating in North America by state. The darker orange indicates the number of trucks operating in that state is bigger, and vice versa. As we can tell from the sample graph, Kenworth sells most of the trucks to California.
Trucks Under Different Mileage
To compare the market under different conditions, this graph shows 3 maps side by side to reveal the different number of trucks operating in North America with an daily mileage of 150, 300 and 450, which correspond to the batteries they would require to use. The darker color indicates a larger number of trucks operating in that state.
Charging Stations Market Opportunity
To help Kenworth place charging stations with low construction electricity cost and maximize revenue, the electricity bar charts sort electricity price per state by End-use sector, showing which state has a low electricity price. In addition, with a diesel price bar chart, we calculate the cost in dollar per mile for both diesel and electricity to show a comparison.
ZEV Credit Calculator
In order to follow ZEV credit requirements, Kenworth is required to convert a certain percentage of total diesel truck sales to ZEV sales every year. This is important to Kenworth as Kenworth needs to make sure that there are enough credits from ZEV sales to cover the deficits created by diesel truck sales to reach regulation breakeven. To help Kenworth realize this goal, this calculator predicts the future credits and deficits created by truck sales according to the class and the type of the trucks as they have different modifiers to calculate credits and deficits.
ZEV Sales Prediction
This line chart shows the sales prediction of Zero-Emissions Veichles in 3 ways: total prediction of both US and Canada, US and Canada
CO2 Prediction By Fuel
This dotted line chart shows the prediction of CO2 emissions caused by using different fuels, coal, natural gas, petroleum, and other fuels
Overall Benefit
By utilizing the above features and the scripts we wrote for data analysis, Kenworth will be able to utilize its large quantity of proprietary data more efficiently and automatically. By reading the detailed summaries and guide we provided, Kenworth employees will be able to use the above features to explore the current market and make better decisions about converting diesel-fueled trucks to ZEVs. We hope that we could lay a good foundation for Kenworth Zero Emission projects and help them make more progress. We also hope that by speeding the transformation steps for Kenworth we can make the market more competitive and bring more attention to the importance of sustainability.
Team

Cici Feng
Data Analyst/PM

Doris Yang
Front-End Developer

Lee Shi
Data Scientist

Wensi Xu
Data Scientist
Project Status
University of Washington Information School Capstone project for Winter/Spring 2022 will be continued by Nick Grant nick.Grant@paccar.com